Goal Setting is Often an Act of Desperation, Part III
Note: This is the third of a four-part series on organizational goal-setting.
For the past three months, I’ve been writing about organizational goal-setting. In Part I of the series, I proposed four conditions that organizations should understand prior to setting a goal. In Part II, I introduced the idea of “arbitrary and capricious” education goals and defined this concept as follows: A willful and unreasonable goal without consideration or in disregard of system capability, variation, or stability. I then introduced the first five of my 10 Key Lessons for Data Analysis:
Lesson 1: Data have no meaning apart from their context.
Lesson 2: We don’t manage or control the data; the data is the Voice of the Process.
Lesson 3: Plot the dots for any data that occurs in time order.
Lesson 4: Two or three data points are not a trend.
Lesson 5: Show enough data in your baseline to illustrate the previous level of variation.
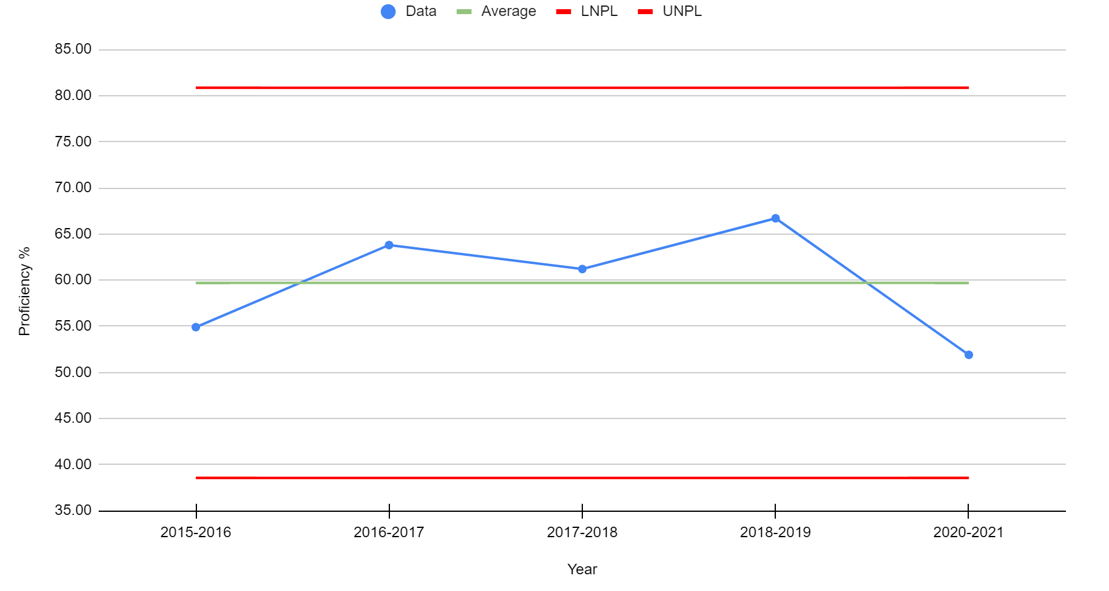
In this installment, I’ll outline key lessons 6-10 and then tie up the series in Part IV with an applied example from United Schools Network. It is worth noting again that the lessons center process behavior charts like the one included as Figure 1 below and in Part I of the series. I believe deeply in this methodology because those who fully grasp these methods (1) have the ability to understand messages contained in their data; (2) have the ability to differentiate between common cause and special cause variation; and (3) know the difference between reacting to noise and understanding signals.
Figure 1. Ohio 3rd Grade Reading State Testing Proficiency Levels, 2016-2021
10 Key Lessons for Data Analysis: Lessons 6-10
Lesson 6: The goal of data analysis in schools is not just to look at past results, but also and perhaps more importantly, to look forward and predict what is likely to occur in the future.
Process behavior charts provide a better approach to the interpretation of data because they take the effects of variation on the data into account. These charts allow us to classify variation as either routine (common cause variation) or exceptional (special cause variation) and in turn allow us to focus on the behavior of the underlying system that produced the results. This focus on the system and its processes is the basis for working towards continual improvement.
Lesson 7: The improvement approach depends on the stability of the system under study.
A system that is producing predictable results is performing as consistently as it is capable. It is a waste of time to explain noise (common cause variation) in a stable system because there is no simple, single root cause for noise. Instead, if the results are unsatisfactory the appropriate focus is working on improvements and changes to the system. Allow me to say this another way: we can improve a common cause process or system by working on the design of the system, including the inputs and throughputs that are a part of it. In contrast, in an unpredictable system that displays special causes, it is a waste of time to attempt to improve or change the system until it is stable again. In this type of system, you must investigate and try to identify what caused the data points to be different. Then, you want to study and remove the special causes affecting the system to return it to a stable, predictable state. The inability to recognize these two different improvement roadmaps is the source of tremendous confusion and wasted effort in the education sector.
Lesson 8: More timely data is better for improvement purposes.
State testing data isn’t very useful for improvement purposes because it is only available once per year and results often arrive after students have gone on summer vacation. It is better to have more frequent data, so we can understand if an intervention is having its intended effect. Most importantly, the frequency of data collection needs to be in sync with the improvement context, and no matter the frequency of collection, we shouldn’t overreact to any single data point. Ultimately, the data allows us to understand the variation and trends within our system, whether our system is stable or unstable, and what type of improvement effort would be most effective.
Lesson 9: Clearly label the start date for an intervention directly in the chart.
A change idea or intervention should be clearly marked in your process behavior chart. This can be done by inserting a dashed vertical line on the date the intervention is started and should include a simple label that captures the essence of the intervention. This allows the team to easily see the data prior to and after the implementation of the change idea. The three rules for finding signals can then be used to see if the intervention is indeed bringing about the intended improvement.
Lesson 10: The purpose of data analysis is insight.
Dr. Wheeler taught us that the best analysis is the simplest analysis which provides the needed insight. Plotting the dots first on a run chart and then on a process behavior chart is the most straightforward method for understanding how our data is performing over time. This understanding is much more intuitive to comprehend than data stored in tables, and patterns in this data become much more apparent using time-sequenced charts.
A Better Way
Understanding variation as illustrated in process behavior charts allows us to clearly see the story being told by our data. It also allows us to more clearly understand if interventions we are attempting within a system are having the desired impact. The process behavior chart and the way of thinking that goes along with understanding variation are powerful tools that we can utilize for school improvement efforts. We often talk about a better way. The more that I’ve studied the System of Profound Knowledge the more convinced that I’ve become that these methods of continual improvement are that better way.
***
John A. Dues is the Chief Learning Officer for United Schools Network, a nonprofit charter management organization that supports four public charter schools in Columbus, Ohio. Send feedback to jdues@unitedschoolsnetwork.org.