Goal Setting is Often an Act of Desperation, Part I
Note: This is the first of a four-part series on organizational goal-setting.
At a recent district leadership team meeting, I put the following quote up on a slide: “Goal setting is often an act of desperation.”[1] We are in the midst of updating our strategic plan at United Schools Network, so the purpose of the quote was to start a discussion on healthy goal-setting and to provide a framework for any goal-setting the team would do as a part of this process. I think the typical reaction to the quote is something like the following: “But I thought goal-setting was something highly effective people and organizations do?” I would argue however, that this is rarely the case, be it in organizations or accountability systems, and only can be true if a number of conditions are met during the process.
In Part I of this series, I’m going to outline four such conditions that are prerequisite for healthy goal-setting. In Parts II and III I’ll outline 10 Key Lessons for Data Analysis, and tie up the series in Part IV with an example using data from within United Schools Network to bring the lessons to life.

Four Conditions for Healthy Goal-Setting
In my experience in the education sector over the last two decades, we often choose goals in important areas out of thin air, build an accountability system around those goals, and then rate and rank schools based on how they perform in relation to those goals. A good example of this is the expectation in Ohio that 80% of 3rd-8th graders will score Proficient on state tests. But, why not 82.5%? Or, 60%? Or, 85%? Or, 95%?
How was 80% chosen as the benchmark for passage rates?
My hunch is that the 80% rate was chosen arbitrarily, and in the absence of some important considerations. I’d like to put forth four conditions that organizations should understand prior to setting a goal.
Organizations should understand the capability of the system or process under study.
Organizations should understand variation within the system or process under study.
Organizations should understand if the system or process under study is stable.
Organizations should have a logical answer to the question, “By what method?”
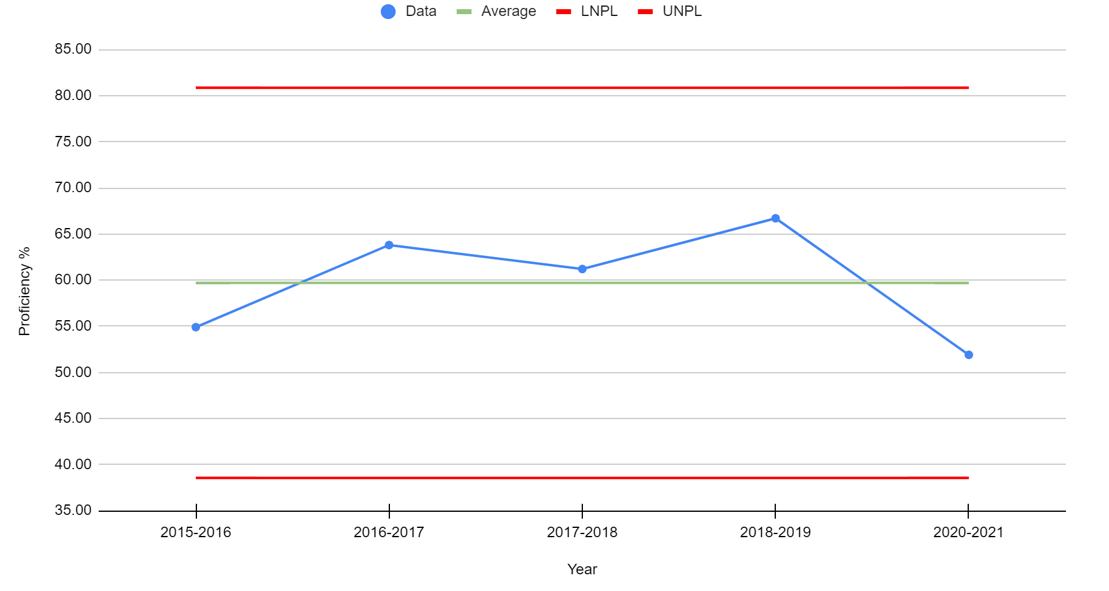
Let’s take a deeper look at the implications of each of these four conditions using 3rd grade reading state testing data. Proficiency rates since the 2015-2016 school year are displayed in the process behavior chart in Figure 1 below (see here and here for more information on these charts if you are not familiar with them).
Figure 1. Ohio 3rd Grade Reading State Testing Proficiency Levels, 2016-2021
Understanding System Capability
Beginning with the Spring 2016 testing season, the Buckeye State began administering the Ohio State Tests. In order to meet the state’s benchmark, schools need at least 80% of their students to score Proficient or higher in each tested area. Let’s look at how Ohio’s 3rd graders are performing on the state’s reading test. In other words, we are going to figure out the capability of this particular system. The system being the third graders in Ohio public schools, their teachers, their reading curriculum, their schools, and any number of other in-school and out-of-school variables that impact the performance of a 3rd grader on the state test.
This capability is outlined in the process behavior chart above. For the five years for which we have testing data on the Ohio State Tests (there was no test given in 2019-2020 because of the pandemic), it is pretty clear that the system of education in Ohio is likely incapable of hitting that 80% mark. Specifically, the red Natural Process Limits tell us that we could expect this system to produce proficiency rates between 38% and 80%, which is why I said 80% is unlikely rather than impossible.[2] In other words, the 80% target is completely disconnected from the system’s current capability (based on how the limits are calculated there is approximately a 3 in 1,000 chance to achieve the goal).
Understanding System Variation
The data in Figure 1 help us to understand the variation in our system. In the case of the five data points we have in this system, we can see that it is bouncing around an average of 59.7%. We have two points below the average, including the most recent test administration, and three points above the average. The year-to-year test results increase, then decrease, then increase, and then decrease across the five years. There are no signals in the chart to indicate that any of the increases or decreases are of significance (see here for more information on rules for finding signals). While five data points represent a limited amount of data, it is pretty clear from what we see so far that setting the 80% goal has had no impact on the outcomes of the 3rd grade reading system.
Understanding System Stability
A system that is producing predictable results is performing as consistently as it is capable. Ohio’s 3rd grade reading system is a stable system. Based on the results thus far, we can reasonably expect that future results will continue to bounce around the current average. However, the results are clearly unsatisfactory. In our 3rd grade reading system, less than 60% of students are achieving Proficiency on average over the last five years. So, we have a stable system that is producing less-than-desirable outcomes. It can only be improved by working on the design of the system, including the inputs and throughputs that are a part of it. This is a very different approach than setting a goal and then holding educators accountable to this goal.
By What Method?
As previously mentioned, the state’s 80% goal is very likely beyond the capability of the system. Some schools within Ohio regularly surpass this benchmark and many others are nowhere near it. My a priori hunch is that, like the overall system, individual school’s 3rd grade reading test results are fairly stable. The low-scoring schools stay low-scoring and the high-scoring schools stay high-scoring. The 80% target is a sorting mechanism rather than an improvement roadmap.
So, this brings us to the all-important question: By what method? By what method could we achieve the 80% goal? Even better, by what method could we ensure that all Ohio students were able to read proficiently? While I have some ideas, I certainly don’t have the silver bullet solution. The one thing I do know is that hoping to bring about this improvement by setting a goal is an act of desperation.
***
John A. Dues is the Chief Learning Officer for United Schools Network, a nonprofit charter-management organization that supports four public charter schools in Columbus, Ohio. Send feedback to jdues@unitedschoolsnetwork.org.
Notes:
[1] This quote comes from Dr. Donald Wheeler in: Donald J. Wheeler, Understanding Variation: The Key to Managing Chaos, 2nd ed. (Knoxville, TN: SPC Press, 2000), 84.
[2] A run chart can be converted into a process behavior chart once we have enough data to construct the Natural Process Limits. In practice, limits based upon an average moving range will begin to solidify when 17 or more values are used in the computation of those limits (when using the median moving range solidification begins when 23 or more values are used in the computation). But we often must work with fewer data points in real life, and useful limits can be computed with as few as five or six values.