Leadership & the Essential Elements of Transformation
Note: This is a bonus article to the five-part series on W. Edwards Deming’s System of Profound Knowledge that I recently completed. It may be helpful to read that series prior to this post; it can be accessed here.
The case I’ve been making for organizational transformation is based on the premise that our education system is not broken. Rather, it is a system that is operating exactly as it was designed to operate, and it’s producing exactly what it was designed to produce. I do not believe that our schools need reform or restructuring but rather a change in state. This transformative change in state does not occur overnight, but instead is a process that unfolds over 5-10 years (as Deming would put it, “There is no instant pudding!”). It’s a cooperative process between those that have the authority to change the system (teachers, administrators, school board), and those that are working in the system (students). This is the essence of continual improvement.

In my study of the System of Profound Knowledge, I’ve found that there are four essential elements to organizational transformation. First, a senior leader within the organization has had to have undergone the individual transformation process or at least be in the process of doing so. Second, the organization has to have adopted a systems perspective. Third, the organization has to have the capacity to understand and use a set of essential statistical methods based on the theory of variation. Fourth, the leadership of the organization has to provide an environment conducive to creating a culture of continual improvement. It may be helpful here to expand on each of these four elements.
Essential Elements
Perhaps the most radical idea put forth by Deming is the idea that any outcome we see within our system is the result of more than the skills and efforts of the individuals that work within the organization. Most of the performance differences observed between individuals are generated by the complex and dynamic system in which workers are only one part. Understanding this idea may be the most important part of the individual that has been transformed. Once the individual leader transforms their thinking (Element 1), then there are some natural extensions of this thinking in terms of creating a culture of continual improvement (Element 4). These extensions tap into the psychological component of the System of Profound Knowledge and include at least three core ideas. The first idea is that everyone has the right to joy in work (or joy in learning in the case of a student). The second idea is that the leader has to drive out fear and create an environment where people are free to question, experiment, learn, fail, cooperate, and innovate. The third idea is that the transformed leader understands the theory of motivation. Extrinsic motivators such as performance appraisals or incentive pay do not work or improve performance. The job of the leader is not to motivate people that work in the system, but rather to remove the barriers to joy in work, which in turn allows people to tap into the intrinsic motivation that drove them to become educators in the first place.
When you combine the transformed leader (Element 1) and a culture of continual improvement (Element 4) with systems thinking (Element 2) and an understanding of the theory of variation (Element 3) a very different approach to leadership and management emerges. Returning to the 8th grade math classroom from the Variation is the enemy post will help to bring to life what these elements look like on the ground in a real school that has begun to put them into practice.
The Shift to Remote Learning
Schools in Ohio were shut down due to the coronavirus pandemic in March 2020. Most schools had just a few days to put a plan in place as they transitioned from traditional in-person learning to fully remote learning. This was no different at United Schools Network as we shifted to remote learning in just a few short days except that I had begun my study of the System of Profound Knowledge and was beginning to apply it within our schools. There was a recognition that the remote learning environment was in fact a whole new system, and our schools were concerned with the level of student engagement in an online environment. My early understanding of Deming’s theory had a significant influence on our approach to this transition. The Deming lens was especially transformational in our middle schools where we already had an ongoing project and an improvement team in place. We worked to answer three important questions as we went on shut down: How do we measure engagement? How do we collect engagement data? Once we have the data, how do we know if we are improving engagement levels? Our response to each of these questions was heavily influenced by Deming’s System of Profound Knowledge.
We first worked to draft an operational definition of remote learning engagement. Without this shared definition, consistent measurement of the concept of engagement across our system would not be possible. The team settled on the following: A USN middle school student demonstrates engagement in a remote lesson by completing the accompanying practice set in its entirety. The team then worked to start collecting engagement data in each grade level and subject area. This data was first stored in tables. Up to this point, we had answers to the first two questions. There was a shared operational definition of engagement and a systematic data collection protocol. However, it wasn’t until we took the engagement data out of the tables and put it into the process behavior charts like the one depicted in Figure 1 below that we could begin to answer the third question-how do we know if we are improving?
Remote Learning Engagement
We’ll turn now to that 8th grade math classroom to see what was happening 24 days into the remote learning transition. Figure 1 depicts the daily engagement rates in this classroom, but it includes one additional piece of information in the thought bubble that is critical to understanding the theory of variation as applied to systems. The technical aspects of the process behavior chart are beyond the scope of this article, but there are a few important points that will help in understanding how the essential elements work in their application in real schools and classrooms. In the thought bubble it says, “This is the ‘voice of the process’ speaking to us, even if it’s saying something different than we might like to hear.” The voice of the process simply means that this is the data that will be produced within our system based on the numerous variables that contribute to a student engaging or not engaging with the math practice set each day.
Figure 1. 8th Grade Math Remote Learning Engagement (%): Days 1-24
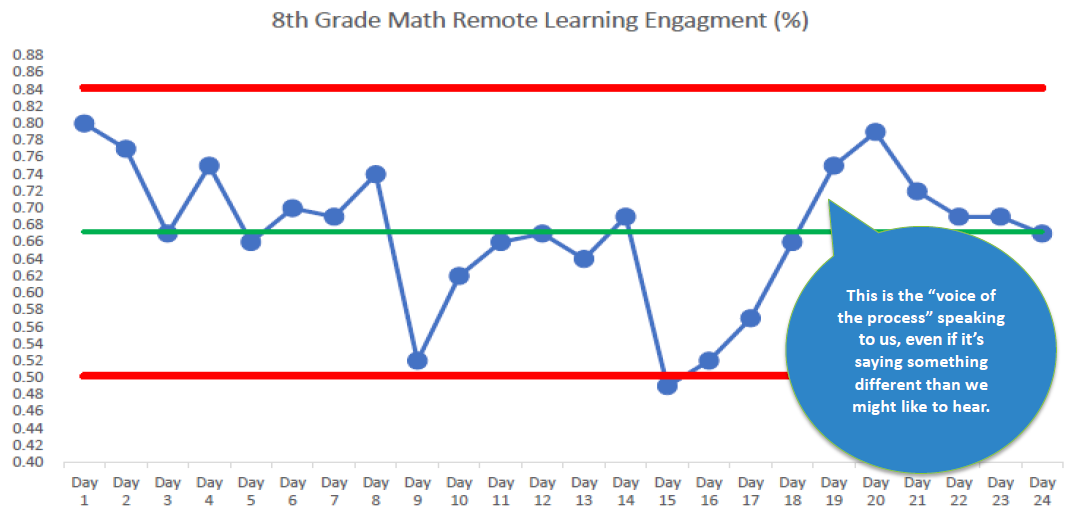
Let’s first break down what is being displayed in Figure 1. Each blue dot represents the daily engagement levels of the 8th graders in their math class. On Day 1, 80% of the students completed the entire practice set for the math lesson. On Day 9, 52% of the students completed the entire practice set for the math lesson. The green line running through the middle of the chart represents the average engagement rate (67%) for the entire data set of 24 points. The red lines represent the control limits of the system, and are set using a formula. The critical point to understand for this example is to know that the red control limits have nothing to do with our goals for engagement. They simply represent the boundaries of the 8th grade math system between which we would expect the data points to fall should the system continue to function as it currently is. Think here of the normal curve. The red control limits are equivalent to +/- three standard deviations, and so represent 99.73% of the data in the system. Based on what has happened across the 24 days, there is only a 0.27% chance a data point would fall outside these control limits.
Understanding Variation
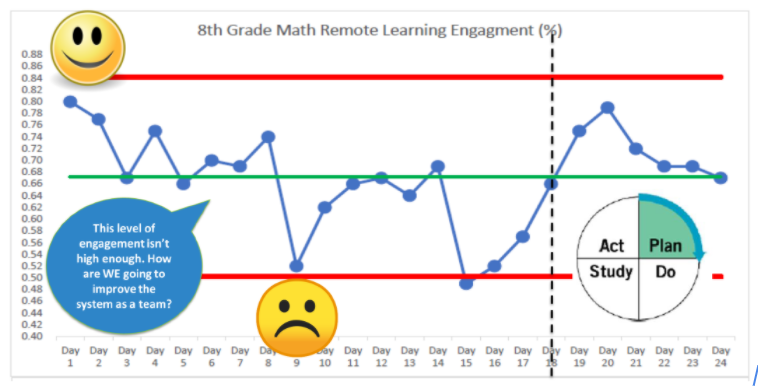
Now that we have the basics of the process behavior chart down, let’s turn now to how the transformed leader would interpret what is happening in the 8th grade math class. We’ll do this by adding some additional graphics to the 8th grade process behavior chart in order to illustrate key points.
Figure 2. 8th Grade Math Remote Learning Engagement (%) with Graphics
Most importantly, the transformed leader will recognize that the performance of the 8th grade math system is by and large a product of the system and not simply the individuals working in the system. In most schools, the principal may go up to the teacher on Day 1 when the engagement in this system is relatively high and give them a pat on the back. On Day 9, they may return to the teacher and ask for an explanation for the much lower engagement rate. In either case, both the pat on the back and the admonishment would be a mistake. The systems thinker would recognize that most of the variation in engagement rates is attributable to the system rather than the teacher. This system includes numerous variables (teacher, teaching methods, students, curriculum, access to technology, access to the internet, home environment and many (if not countless) variables). The leader with an understanding of the theory of variation would recognize that any data points, such as those on Day 1 and Day 9, that are between the red control limits are what Deming called common cause variation. These causes of variation are inherent in a process over time; they affect every outcome of the process and everyone working in the process. Any explanation the teacher gave about the Day 1 or Day 9 data would be a work of fiction; there is no way for anyone to know why more students were engaged on Day 1 than on Day 9.
Improving the System
In analyzing the engagement data further, one would recognize that the shift to remote learning has impacted student engagement. Prior to the pandemic, the school’s attendance rate was 93.2%. After the shutdown, the average engagement rate in 8th grade math had fallen to 67% during the first 24 days of remote learning (There is a difference between attendance and engagement, but I’m working from the assumption that all or nearly all students in attendance engage in the practice set during in-person learning). Both the teacher and principal would agree that the practice set engagement levels aren’t high enough. But instead of praising the teacher on days of higher engagement and asking for explanations on lower engagement days, the transformed leader would instead approach the teacher and ask: How are WE going to improve the 8th grade math system (the transformed teacher would ask the same question of students)?
Thinking back to the overview of the Theory of Knowledge (see the post in this series entitled Knowledge has temporal spread), Deming offers a way forward. This is represented by the vertical dotted line and the Plan-Do-Study-Act icon on the process behavior chart. At the point that the team recognizes that there is a need to improve the system, they can then work together to design and test a change idea through the PDSA cycle. The purpose of this experiment is to provide a structured approach to improvement where the change idea is systematically tested to see if it in fact brings about improved rates of engagement. The role of leadership then is not to motivate, but rather to remove the barriers to joy in work. A big part of this occurs in working together with the individuals in the organization to improve the system rather then attempting to improve and blame the individuals that work in the system.
This example is the System of Profound Knowledge in action in a nutshell and represents a transformational approach to school improvement.
***
John A. Dues is the Chief Learning Officer for United Schools Network, a nonprofit charter-management organization that supports four public charter schools in Columbus. Send feedback to jdues@unitedschoolsnetwork.org.