Understanding variation: the key to data analysis
The #1 reason why educational leaders misinterpret their data is they don’t take natural variation into account when doing the analysis. Instead, they make comparisons between a current figure and some previous value.
But, this simple and limited comparison cannot fully capture and convey the behavior of data that occurs across time. This leads to overreacting, or less frequently, to underreacting to data.
I am going to teach you a method that will allow you to react less and improve more, a win-win for educational leaders with limited time and resources.
Two Flavors of Variation
Variation comes in two flavors, routine (aka natural variation) and exceptional. The key is knowing how to tell the difference. The inability to recognize this difference is the source of tremendous confusion and wasted effort in schools.
This is where the process behavior chart comes into play. It allows us to determine what type of variation is present. It also allows us to determine if a system is predictable or unpredictable. Once we have this understanding we can chart an improvement road map that makes sense.
What is a Process Behavior Chart?
Process behavior charts are time sequenced charts with Upper and Lower Natural Process Limits on which values of some measure are plotted. The chart frequently shows a central line to help detect a trend of plotted values toward either limit.
The chart below shows the percent of students who scored proficient or higher on the Ohio 3rd grade ELA state test from Spring 2004 through Spring 2015. Key parts of the chart are labeled for easy identification.
Anatomy of a Process Behavior Chart
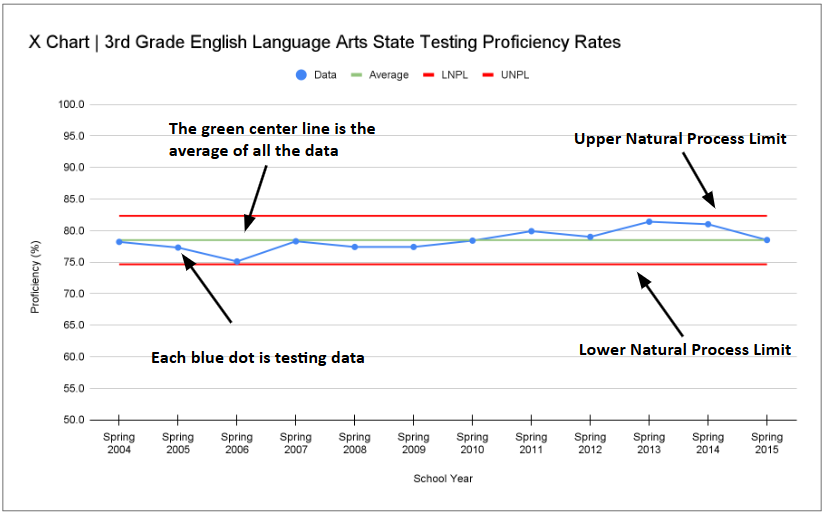
The purpose of a process behavior chart is to separate routine and exceptional variation. The data in the chart above is a great example of routine, natural variation.
The results for these years are simply bouncing around an average of 78.5%. Sure, there are some years where the data increases and some years where it decreases.
But, none of those increases and decreases are meaningful.
Old Way: Simple, Limited Comparisons
Most leaders rely on comparisons between a current figure and some previous value. Who hasn’t compared this year’s test scores to last year’s scores?
The problem is this limited comparison doesn’t take natural variation into account. In other words, we try to ascribe meaning to increases or decreases between two data points when in reality there is often no difference to be found.
Here’s a great example of this. The snapshot below is from a 2017-18 state test results document published by the Ohio Department of Education (ODE). It’s as relevant today as it was when it was published eight years ago.
Ohio Department of Education Testing Results
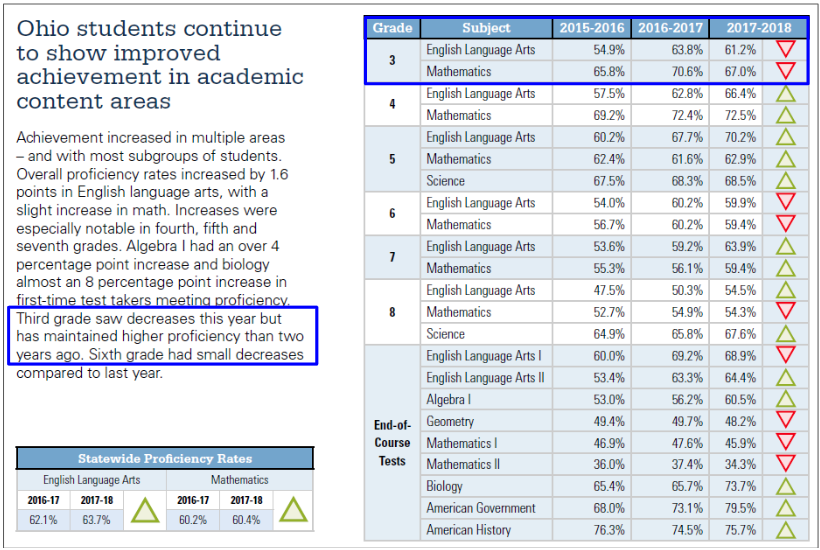
We’re being led to believe that a meaningful decline in performance has occurred in 3rd grade ELA. That is what is signified by the red arrow in the first row of the table.
But, then we are encouraged to not worry too much because, “Third grade saw decreases this year but has maintained higher proficiency than two years ago.”
So which is it: Should I be worried about my 3rd grade ELA state test scores because of the most recent decrease in scores? Or, should I not worry because the scores are better than they were two years ago?
We’ll be able to answer these questions in the next section once we analyze the data using the understanding variation method.
New Way: Understanding Variation Method
I took the data from the three years of state testing for 3rd grade ELA listed in the ODE document and plotted it on a process behavior chart.
Then, I continued plotting the more recent results. The chart below has the nine available data points from Spring 2016 through Spring 2025.
Ohio 3rd Grade ELA State Testing Results, 2016-2025

There is no evidence of improvement. Instead, the nine data points are bouncing around an average of 61% (3 pts below, 1 on the line, 5 pts above). The results increase, then decrease, then increase, then decrease, then increase four times.
There are no signals, or patterns in the data, to indicate changes of significance. This is how most data looks over time. Claims of improvement are often nothing more than writing fiction.
The key for leaders is the recognition that a system that is producing predictable results is performing as consistently as it is capable. It is a waste of time to explain natural variation in a stable system because there is no simple, single root cause for this noise.
Instead, if the results are unsatisfactory, and they are with the 3rd grading ELA results (2 in 5 students are not reading proficiently), the appropriate focus is working on improvements and changes to the system.
Summary
If you’re a school leader and you’ve struggled to interpret your most important data, you’re not alone. Most of us were never taught to understand the variation in our data. Two big ideas from this article can help put you on the right track.
Big Idea 1: You must take natural variation into account when doing data analysis.
Big Idea 2: Use process behavior charts to differentiate between routine variation and exceptional variation.
The insights that come from understanding variation could be just what you need to turn your data analysis into better outcomes.
***
Whenever you’re ready, there are 3 ways I can help you:
Transformation requires a whole new way of thinking. Understanding variation in your most important data is a good place to start. In this 20-minute introductory course I will teach you a method that will allow you to react less and improve more, a win-win for educational leaders with limited time and resources.
Learn how to use improvement science rooted in the Deming philosophy to design simple experiments that lead to solutions that actually work in your schools, all without wasting time and money and burning out frontline educators. For education leaders who’ve heard of improvement science but aren’t sure where to begin, I can support you on this journey.
Win-Win is the improvement science text for education leaders. The aim of the book is to equip you with the knowledge and skills needed to use the System of Profound Knowledge, a powerful management philosophy, to lead and improve school systems.
***
John A. Dues is the Chief Learning Officer for United Schools, a nonprofit charter management organization that supports four public charter school campuses in Columbus, Ohio. He is also the author of the award-winning book Win-Win: W. Edwards Deming, the System of Profound Knowledge, and the Science of Improving Schools. Send feedback to jdues@unitedschools.org.