Knowledge about Variation
The System of Profound Knowledge was developed by W. Edwards Deming across a lifetime of improvement work. It provides a map of theory by which to understand the organizations that we work in. The theory has four parts that interact to form the science of improvement: (1) Appreciation for a System, (2) Knowledge about Variation, (3) Theory of Knowledge, and (4) Psychology.
The aim of this month’s post is to describe the Knowledge about Variation component.

What Does the Data Tell Us?
There is variation in everything we observe and measure in schools. Knowledge about Variation provides a tool kit by which to understand this variation. Educators are inundated with data, but what’s much more difficult is knowing how to interpret and make sound decisions with it. Do this year’s state test scores indicate that our district is improving? Was last month’s drop in per pupil revenue a sign of things to come? Did attendance rates improve this week because of the intervention we put in place or was it due to something else? The ability to answer questions like these is fundamental to our ability to make improvements.
USN’s schools started the 2020-2021 school year using a remote learning model. An 8th grade math teacher was concerned about daily engagement rates because of his experience with remote learning from the previous spring when schools were initially shut down because of the pandemic. He defined a student as engaged when they completed the math practice set that accompanied each lesson video. Table 1 displays the engagement rates for his students for the first 24 days of the school year.
Table 1. 8th Grade Math Engagement Data
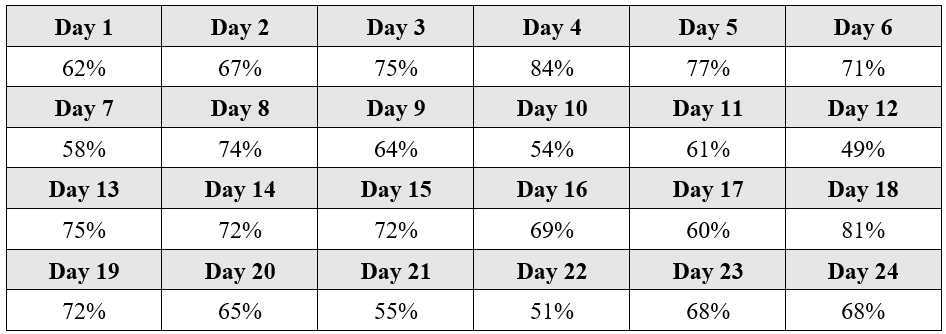
If you were working with the 8th grade math teacher, what conclusions would you draw based on these data? Are engagement rates improving or declining? How do we improve engagement rates? Knowledge about Variation is needed to answer these questions and to take appropriate action.
Shewhart’s Influence
W. Edwards Deming’s understanding of variation was heavily influenced by Dr. Walter A. Shewhart, a physicist at Bell Labs who developed a theory for variation as well as a tool called a control chart in the 1920s. Control charts are sometimes referred to as Shewhart charts or process behavior charts.
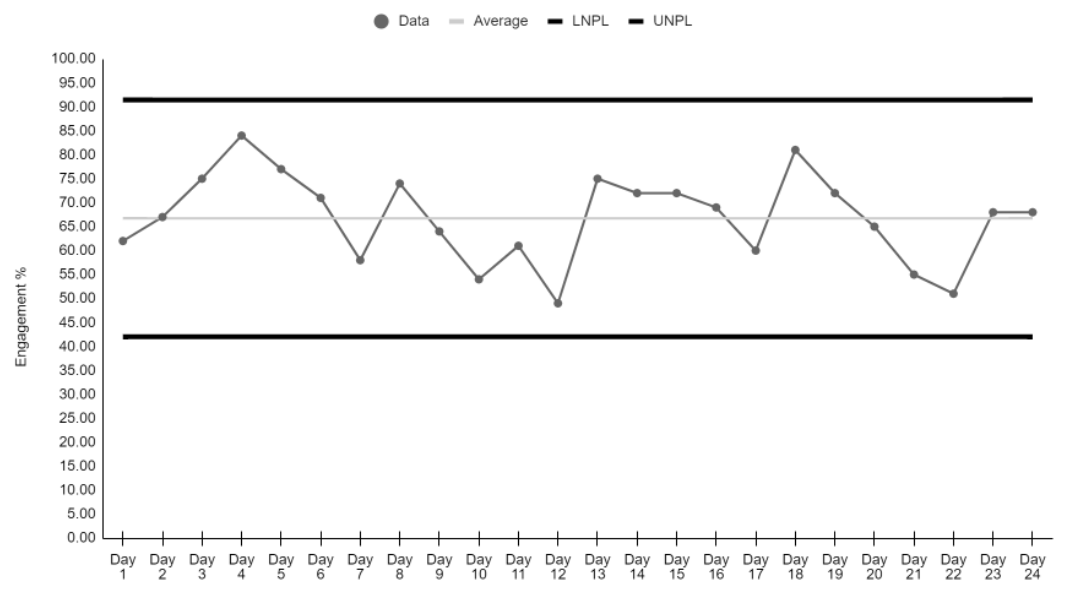
Shewhart’s theory emphasizes the importance of plotting data over time, what I’ve come to call plotting the dots. Plotting data on a chart and connecting consecutive points with a line makes analysis far more intuitive than data stored in a table like Table 1. Process behavior charts examine data from a process (or system) to determine if the process is predictable or unpredictable. Shewhart’s Theory of Variation employs the process behavior chart to separate these two situations, the predictable and the unpredictable, based on the patterns of variation in our data over time. One pattern of variation includes common causes (aka “controlled variation” or “noise”). Common cause variation includes causes that are inherent in a process over time and affect every outcome of the process and everyone working in the process. A second pattern of variation includes special causes (aka “uncontrolled variation” or “signal”). Special cause variation is a name for sources of variation that are not part of the process all the time, or do not affect everyone, but arise because of specific circumstances. Figure 1 displays the math engagement data in a process behavior chart.
Figure 1. X Chart: 8th Grade Math Engagement Data
Stable & Unstable Processes
A process with predictable variation has only common causes affecting outcomes and is called a stable process. In this situation, the variation is the result of many different cause-and-effect relationships where no single cause is dominant over the others. Every process is subject to many cause-and-effect relationships, but in a stable process the net effect of all of these relationships is a sort of equilibrium. This should not be taken to imply that there is no variation present or even that the variation is small within the process, but rather that it is predictable within statistically established limits. The limits in the 8th grade math system are represented by the heavy black lines in Figure 1, the Upper Natural Process Limit (UNPL) and the Lower Natural Process Limit (LNPL). The key take-way is that a system that is producing predictable results is performing as consistently as it is capable. It is a waste of time to explain common cause variation in a stable system because there is no simple, single root cause for noise. Instead, if the results are unsatisfactory, the appropriate focus is working on fundamental changes to the system itself.
In contrast, a process whose outcomes are impacted by both common cause variation and special cause variation is called an unstable process. The instability does not in and of itself imply large variation, but rather that the changes from data point to data point are of a magnitude as to be unpredictable. In an unstable process where special causes of variation are present, it is a waste of time to improve or change the system until it is stable and predictable. In this type of system, you must investigate and try to identify what causes the data points to be so different, and then to remove the special causes affecting the system in order to return it to a stable, predictable state.
The process behavior chart is the tool that allows us to determine what type of variation is present in our system and whether the system is stable or unstable. The inability to recognize the difference between common causes and special causes of variation is the source of tremendous confusion and wasted effort in the education sector. Deming categorized this misinterpretation as Mistake 1 and Mistake 2. Mistake 1 occurs when we react to an outcome as if it came from a special cause, when it came from common causes of variation. Here we study and try to remove a non-dominant cause of the problem when the only way to improve is to fundamentally change the system. Mistake 2 is the opposite. It occurs when you treat an outcome as if it came from common causes of variation, when it came from a special cause. Here we miss the opportunity to fix a specific, identifiable problem within our system.
In returning to the eighth-grade math engagement rates in Figure 1, we can learn a few important things. First, the data indicate a stable system because the plotted points for the first 24 days remain between the Upper and Lower Natural Process Limits. This means that we can reasonably expect that the engagement levels for this eighth-grade math class will produce similar results in the future. Second, in the first 24 days of remote learning, we don’t see any signals or special causes of variation in the data. One indicator of a signal would be a single point outside of either of the Natural Process Limits. This means that there haven’t been any significant events, either in a positive or a negative direction, to investigate in this eighth-grade math remote learning system. Third, it means that improvement can be achieved only through a fundamental change to the 8th grade math system.
Educational leaders equipped with Knowledge about Variation are able to determine if the variation of important outcomes of a process or system are due to common causes or special causes of variation. This knowledge can help you avoid Mistake 1 and Mistake 2. It can also assist you in charting a proper improvement roadmap while saving energy, time, and money.
Understanding Profound Knowledge
In this post, I introduced the idea of Knowledge about Variation. I’ll cover the final two components of the System of Profound Knowledge in the fall. September’s post will focus on Theory of Knowledge, and October’s post will focus on Psychology. For additional information on how United Schools Network is applying the ideas discussed in this article, you can check out recent interviews on the Lean Blog Interviews Podcast and on the Connecting the Dots podcast.
***
John A. Dues is the Chief Learning Officer for United Schools Network, a nonprofit charter management organization that supports four public charter schools in Columbus, Ohio. Send feedback to jdues@unitedschoolsnetwork.org.