Writing Fiction
Note: This is the fifth of a five-part series on understanding the concept of variation. Knowledge about variation is one of the components of W. Edwards Deming’s System of Profound Knowledge and is fundamental to correctly interpreting data.
Last month, I discussed a powerful tool, the process behavior chart, that can be used to filter the noise out of our data. The whole point of this series has been to think through how to properly interpret and react to data, which includes the filtering process. Unfortunately, much of what happens on the data analysis front in the education sector is akin to writing fiction. Writing fiction will be the main topic of this post.

Is This Improvement?
Let’s return now to the state testing data first introduced in Part II in this series and the accompanying narrative that is displayed in Figure 1.
Figure 1. Ohio School & District Results 2017-2018, Page 2
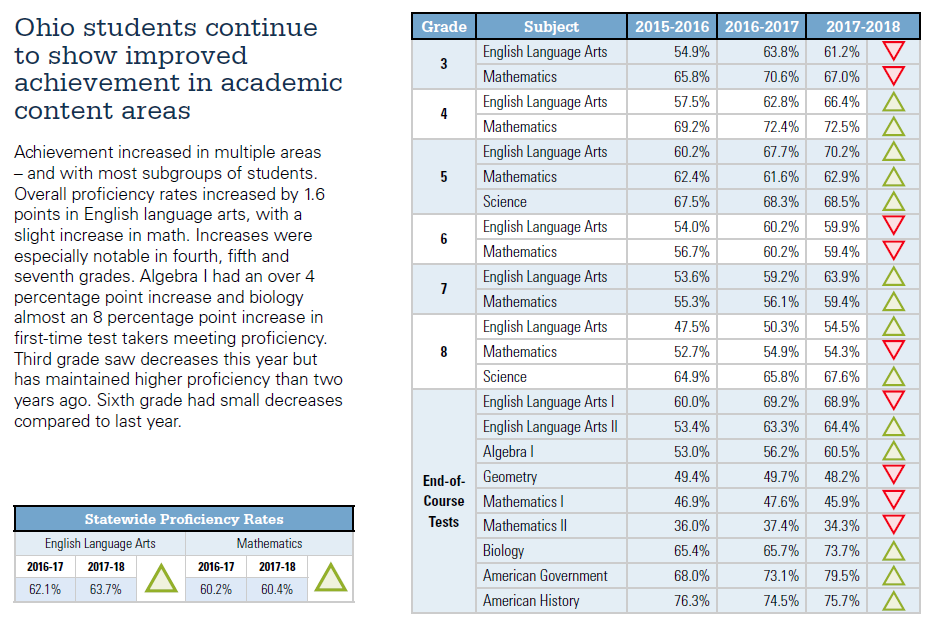
The overall claim accompanying the data is that “Ohio students continue to show improved achievement in academic content areas.” Any claim of improvement has to meet the three parts of the definition of improvement outlined in the post Data Has No Meaning Apart from Their Context. Does the claim hold up to this scrutiny? I would say that it is pretty clear that it does not. Even in the grade levels and subjects where there was a single-year increase in the test data noted by the green arrows, none of the conditions of improvement are met. Is there knowledge for how work or activity was altered systematically across the state in those tested areas to produce the improvement? Are there visible, positive differences in results relative to historical norms (as opposed to changes between two or even three data points)? Has there been a lasting impact? The answer to each of those questions is no (or at the very least we don’t have enough information from the graphic). The three years of test data that are included in the chart are completely divorced from the historical context of these scores as well as from any important conditions that may have changed within Ohio’s testing system.
We’ll narrow our focus from the full list of test scores and just look at what’s happening in 3rd grade English language arts. In the second last sentence in the paragraph to the left of the main table the report says, “Third grade saw decreases this year but has maintained higher proficiency than two years ago.” During the 2015-2016 school year, 54.9% of third graders were proficient on the ELA test. This increased to 63.8% during the following year, and then declined to 61.2% during the 2017-2018 school year. Again, when the data is divorced from historical context there is no way to understand what is going on with 3rd grade ELA test scores with any confidence. In addition to the three components of the definition of improvement, there is also a fourth component in evaluating if an increase or decrease in our data is representative of improvement or a meaningful decline in performance. That is, now that we have some understanding of variation we have to ask ourselves if the ups and downs in this data is only noise or if there are indeed meaningful signals.
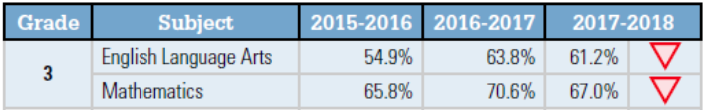
Figure 2. 3rd Grade State Test Results
Understanding Variation: A Better Way
Much of the data we look at in the education sector is organized in tables just like those in Figure 2, and similarly, comparisons are most often being made between 2-3 data points. The only context that we have about what is going on with Ohio’s third graders is that scores increased in 2016-2017 from the previous school year and then declined in 2017-2018. However, the story shifts completely when you look at this same data in context over time. We’ll do this first by turning to viewing the data in a run chart which displays the average proficiency levels on the 3rd grade ELA test between the spring of 2004 and 2019. Spring 2004 was the first time Ohio administered a state-wide ELA test. Spring 2019 was the most recently available data because of the pandemic. Run charts are a simple plot and display of data and trends over a specified period of time. I’ve also noted a number of important annotations in this particular run chart in order to paint a more complete picture of what is happening over time in the world of Ohio’s 3rd grade state ELA testing. Let’s first turn to the run chart, and then we will dive into the annotations.
Figure 3. Run Chart: Ohio 3rd Grade ELA State Testing Proficiency Levels (2004-2019)
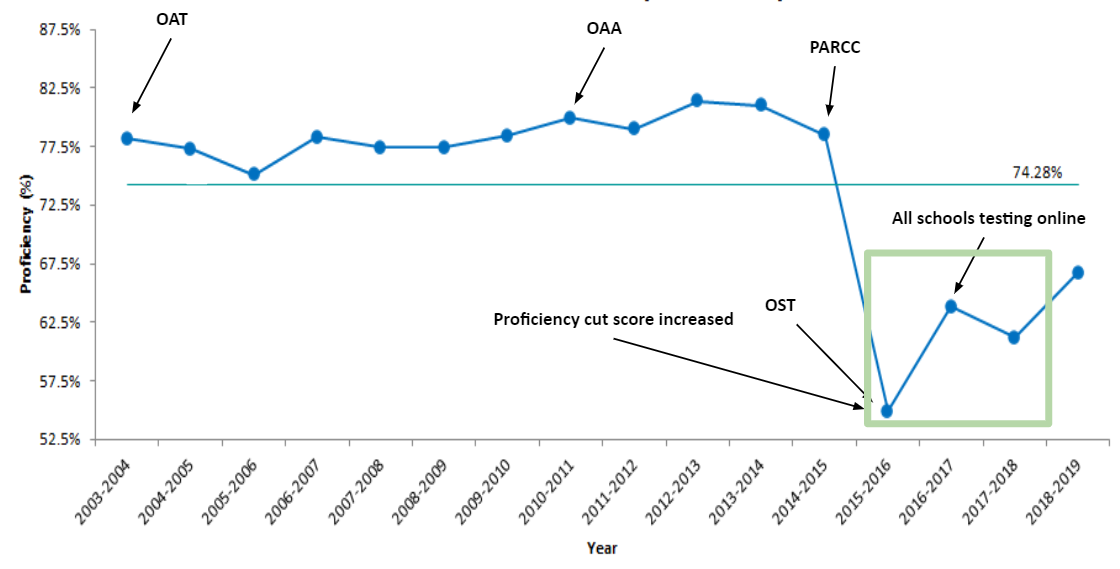
The three data points from the table in Figure 2 are in the green rectangle in Figure 3. When you add in the additional data going back to 2004, as well as the data point from the 2019 test that followed the publishing of the state document, a completely different picture emerges. Between spring testing in 2004 and spring testing in 2015, the data is bouncing around a fairly consistent range of proficiency levels between a low of 75.1% proficiency in 2006 to a high of 81.4% in 2013. But then the scores took a precipitous drop in the spring of 2016 and have been bouncing around a new lower average albeit with what appears to be more year-to-year variance than before this steep drop.
Before going any further with the analysis, let’s take a look at the annotations. The Ohio Achievement Test, or OAT, was rolled out in spring 2004. It’s name changed to the Ohio Achievement Assessment, or OAA, in spring 2011 but largely remained unchanged in terms of test design, test content, and proficiency cut scores. Then, during the 2014-2015 school year the Ohio Achievement Assessment was replaced by the Partnership for Assessment of Readiness for College and Careers, or PARCC assessment. This test differed significantly in design, format, and content from the OAA, but the cut scores for proficiency remained unchanged. As a result, there wasn’t much change in student outcomes in terms of the percent of 3rd graders that scored proficient or better. The following school year, the PARCC was abandoned in favor of what is called the Ohio State Test and the design, format, and content again changed significantly. However, this shift in test design was not likely the primary reason for the drop in scores that accompanied this change. Instead, the primary driver of this downshift in proficiency levels was the higher cut score needed by students in order to score proficient on the test as Ohio attempted to better align these scores to college readiness.
The following year in 2016-2017, all Ohio public schools had to administer the test in an online format. On the PARCC assessment and during the first year of the OST assessment, schools had the choice to administer the test using paper and pencil or online. It’s too early to say for sure given that there are only four data points since the downward shift happened, but it appears that there has been a meaningful change within the 3rd grade ELA state testing outcomes. The only way to say for sure though is to turn the run chart from Figure 3 into a process behavior chart and add natural process limits as I’ve done in Figure 4.
Figure 4. Process Behavior Chart: Ohio 3rd Grade ELA State Testing Proficiency Levels (2004-2019)
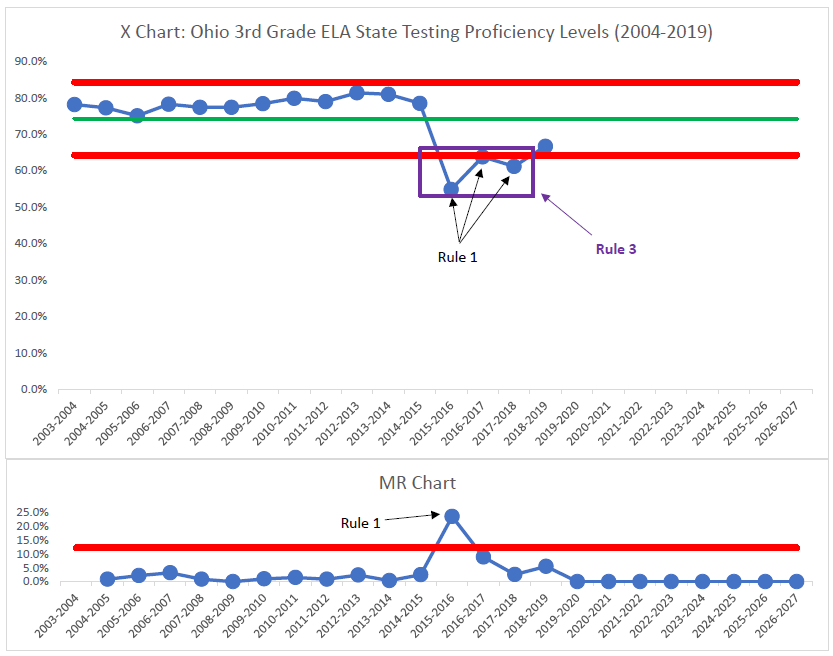
Ideally, we would have a minimum of 20 data points of baseline data (24 data points is the gold standard) prior to drawing any firm conclusions. In the case of the 3rd grade state testing data, we have 16 data points; with fewer data points there is more risk of misinterpreting the data. However, we have three pretty strong indicators that the downward shift in our data beginning in the 2015-2016 school year is a meaningful change. First, during that school year we have a Rule 1 indicator in our X chart (for more on the Rules for Finding Signals, see Part IV in this series). Second, we have a Rule 1 change in our MR Chart, which indicates point-to-point variance far outside of what we would have expected based on data we’ve seen so far. Third, we have a Rule 3 indicator with three data points closer to the Lower Natural Process Limit than they are to the green average line. Those three points are actually not only a Rule 3 indicator, but each of those points is also a Rule 1 indicator in and of itself.
All of this evidence taken together points to the idea that we have indeed seen a meaningful decrease in 3rd grade reading test scores, but this shift encompasses all three years of testing data from Figure 2. This downward shift also aligns to the context of the state testing system changes that I’ve mentioned in this section. However, remember that the conclusion drawn in the state testing document excerpted in Figure 1 is that there were meaningful changes in the 3rd grade reading test data from 2015-2016 to 2016-2017 (increase), from 2016-2017 to 2017-2018 (decrease), and from 2015-2016 to 2017-2018 (increase). There is absolutely no evidence that this is the case. Three data points is far too soon to be drawing any conclusions about what changes in our data mean. This is the essential feature of “writing fiction.” If I had to make a prediction, I’d bet that the more recent data points beginning in 2015-2016 will be nothing more than common cause variation bouncing around a new average. This of course assumes that there aren’t any fundamental changes to the testing system (e.g. changing test vendors, changing test design, changing proficiency cut scores, etc.).
The Problem with Goals
The state’s goal for grade level cohorts of test takers was to have 75% of students in each grade level score proficient or higher through the 2013-2014 school year. As Ohio transitioned from the Ohio Achievement Assessment to the PARCC and then to the Ohio State Tests, the goals were variable depending on grade level and subject during the 2014-2015 and 2015-2016 school years. Beginning in the 2016-2017 school year, the state raised the goal to 80%.
I can almost hear Deming slowly standing and asking, “By what method?” By that he means from where do these arbitrary goals come? And more importantly, what is the plan for achieving this new goal of 80% proficiency in every subject and grade level?
Instead of working together to improve the system of instruction and intervention for 3rd grade readers, there is a tremendous amount of time being wasted performing the mental gymnastics of trying to convince everyone that there is indeed improvement occurring throughout the system. These mental gymnastics, or writing fiction, trickle down to districts and schools as these various accountability reports are released every year. We perform these same exercises of writing fiction with our own test reports that we write up for various internal and external audiences. I want to be clear that I am not talking about anything nefarious here, but rather I am saying we waste a tremendous amount of time comparing year-to-year results. We either celebrate increases in year-to-year results that aren’t meaningful or we attempt to explain away those same types of changes that happen to go in the other direction. Most of the time this fiction writing happens in the absence of acknowledging changes to the context of the testing system itself like those outlined in the run chart in Figure 3. It is likely that almost no one remembers these contextual changes even just a year or two after those changes went into effect.
When people are pressured to meet a target value there are three ways they can respond: (1) they can work to improve the system; (2) they can distort the system; or (3) they can distort the data. In this case, almost all of the reaction and explanation that I see at all levels of the education system in response to state testing results is focused on points two and three, distorting the system and distorting the data. Again, I want to reiterate that I am not talking about anything illegal. Most of what I see falls exactly along the lines of the claims made in the state document from Figure 1. Statements such as “Ohio students continue to show improved achievement in academic content areas” and “Third grade saw decreases this year but has maintained higher proficiency than two years ago” are nothing more than writing fiction. Throughout my career, I’ve been just as guilty of this type of analysis and fiction writing as anyone, but once you understand the right way to interpret data you want to scream from the mountain tops when you see otherwise.
As Donald Wheeler characterizes this problem in Understanding Variation (p. 84): “Goals are one of the greatest causes of creativity!” It’s too early to say for sure, but the four most recent data points from the 3rd grade ELA state testing results seem to be a new system. The early results indicate that the state’s 80% goal is beyond the capability of the system. In order to meet this goal the system will have to improve in some fundamental way. Charting the proficiency rates will not give us insight into how to improve the system nor will it point out the problem spots. The state education department is not going to bring about improvement in the 3rd grade ELA test scores by setting goals for student proficiency rates. The only way to bring about this change is to work together to improve the process of K-3 reading instruction happening everyday in classrooms throughout Ohio. Rolling up our sleeves to bring about this improvement is a much more daunting task than simply admonishing schools who are not meeting the arbitrary 80% target.
This type of improvement will never be brought about through an accountability system, but rather will only come to fruition if educational leaders at all levels have methods for continual improvement including understanding variation. To me, the real win of moving in this direction is that working in schools would be much more fulfilling if we spent less time scurrying about writing fiction and more time working to improve the system using these methods.
***
John A. Dues is the Chief Learning Officer for United Schools Network, a nonprofit charter-management organization that supports four public charter schools in Columbus, Ohio. Send feedback to jdues@unitedschoolsnetwork.org.