The PDSA in Action
Note: This is Part II of a two-part series on the Plan-Do-Study-Act (PDSA) Cycle developed by W. Edwards Deming.
Now that I’ve outlined the basic idea of the PDSA cycle, it will be helpful to turn to a real PDSA that I used in my work at United Schools Network. This in fact was the first PDSA I ever designed, so it by no means is being held up as an exemplar. However, I think it is useful as an introductory point to the concept because this particular example is so simple. I’m also happy to report that for a first attempt, this PDSA cycle was fairly successful.

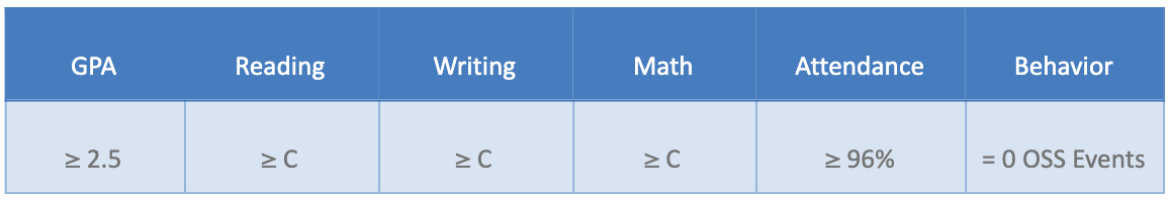
By way of introduction, it will be helpful to understand the context in which this PDSA was designed. During the 2018-2019 school year, I launched a project we called 8th Grade On-Track. I was exposed to on-track work through a grant application to the Bill & Melinda Gates Foundation. Through this application process, I learned of the on-track indicator systems being developed by organizations such as the University of Chicago Consortium on School Research and CORE Districts in California. One such system developed by CORE Districts in Oakland predicted the 8th graders who went on to graduate from high school with 96% accuracy. The systems include a combination of indicators such as GPA, grades, attendance, and discipline events and each indicator has a threshold for on-track. As a part of our project work, the team adopted CORE’s on-track system, and we were studying how our 8th grade students were performing through the lens of these indicators.
Figure 1. 8th Grade On-Track Indicator System
It was through this study that we noticed that James’ reading grade dropped from a B in 7th grade to a D during the first trimester of his 8th grade year.[1] The rest of his grades were a C or higher, his attendance rate was above 96%, and he had never been in serious trouble. Most people would look at James’ academic, attendance, and behavior stats and not see a student that needs intervention, but the improvement team felt otherwise. At the very moment that his reading grade dropped, James needed extra support. What we had learned through our research is that off-track 8th graders become off-track 9th graders, and this is especially problematic because freshman year is the make-or-break year for high school graduation.[2] In most schools, a student like James wouldn’t likely get much attention, but research suggests that his grade drop is a leading indicator of things to come. Grades tend to drop in high school, compared to middle school, by about half a GPA point, and students receiving Ds in the middle grades are likely to receive Fs in high school.[3]
When viewed through this lens, there was urgency to get James back on-track. However, even though we now had a definition of on-track for high school readiness, we didn’t initially have an answer for an important question. How do we get off-track students like James back on-track? While I hadn’t yet completed a deep study of Deming’s improvement theory, I had been exposed to several improvement science tools and techniques including the PDSA cycle. What we developed was a simple but profound innovation by which we combined a technique called the Five Whys with an Empathy Interview to figure out why students like James were off-track.[4] From there, we took that root cause and used the PDSA tool for the iterative testing of interventions. James was in fact the first student with whom we worked after the development of this protocol.
Let’s first look at James’ on-track indicators, Five Whys, and Empathy Interview before turning to his PDSA. It’s worth noting that all the following snapshots of the on-track system, Five Whys, and Empathy Interview for James were originally captured on a large piece of Post It chart paper, so we could post the information for the improvement team to see. This set up became a protocol as we used the same formula with other students as the project progressed. However, for now we’ll just focus on how these tools were used with James and led directly to the design of his PDSA cycle.
Figure 2. James’ On-Track Data & Layers 1-2 of the Five Whys
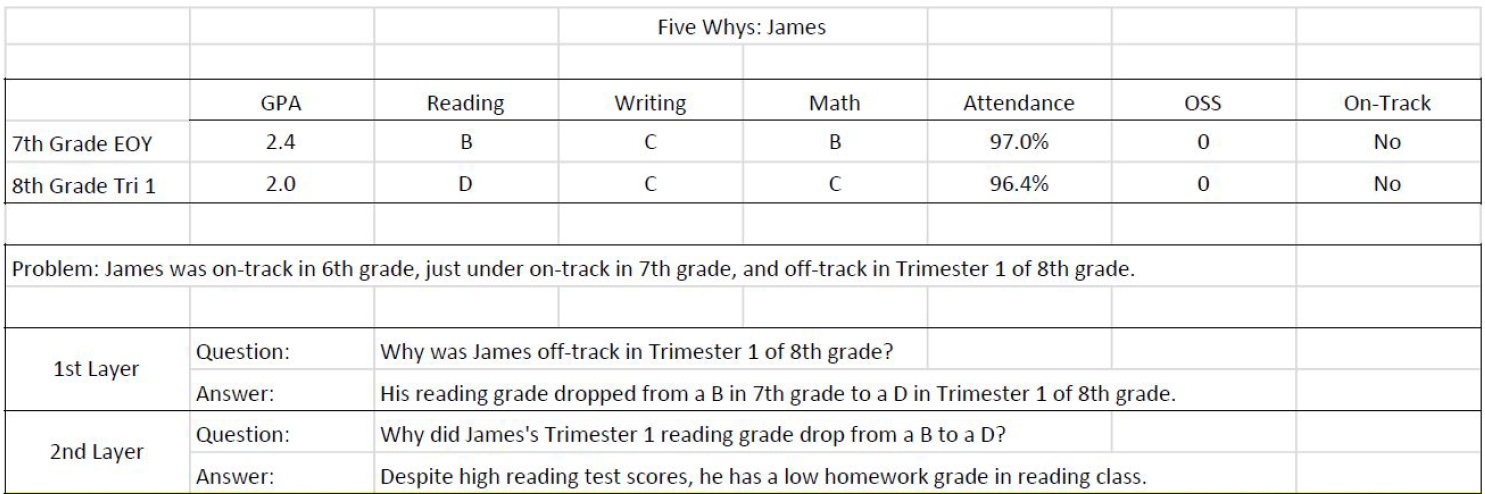
The very top of the Five Whys included the six on-track indicators for James’ 7th grade year as well as the first trimester of 8th grade. In 7th grade, James was doing relatively well, but was considered off-track because his 2.4 GPA fell just below the on-track standard of 2.5. He was on-track in all other areas. At the start of his 8th grade year, his GPA dropped to 2.0 because of the two-letter grade drop in reading. To transition from the on-track indicators to the Five Whys, we first drafted an explicit problem statement as it was currently understood. In this case, the problem statement was as follows: “James was on-track in 6th grade, just under on-track in 7th grade, and off-track in Trimester 1 of 8th grade.”
James’ reading teacher (Dr. Brennan) and I then began the Five Whys process. We based our inquiry in the 1st layer of the tool on the problem statement, and then the 2nd layer question was based on the answer from the 1st layer. So, in the 1st layer the question was “Why was James off-track in Trimester 1 of 8th grade?”, and our answer was “His reading grade dropped from a B in 7th grade to a D in Trimester 1 of 8th grade.” The question in the 2nd layer then was “Why did James’ Trimester 1 reading grade drop from a B to a D?” As we dug into his grade data, we framed our answer to this question as, “Despite high reading test scores, he has a low homework grade in reading class.” The next logical question in this sequence then was “Why does James have a low homework grade in reading?” Notice though that this question doesn’t exactly match the question in the 3rd layer. This has to do with the highlighted portion of the chart in the figure that follows. At this point of the Five Whys, James was invited to participate in the process because the most important information for why James’ reading grade dropped was in his head. The 3rd layer question was modified to read “Why do you have a low homework grade in reading?” You’ll also see that the highlighted portion of the chart below notes that it is at this point that the Five Whys includes an Empathy Interview component because James has joined Dr. Brennan and I in the inquiry, problem-solving, and intervention design process.
Figure 3. James’ Five Whys Layers 3-5
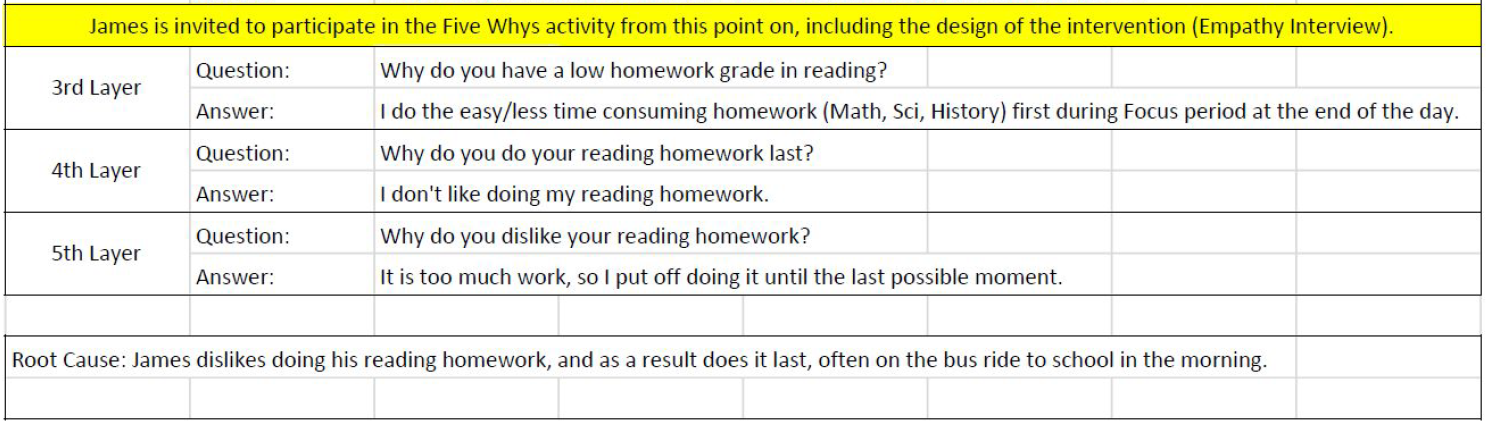
James’ answer to the 3rd layer question was, “I do the easy/less time-consuming homework (math, science, history) first during Focus period at the end of the day (Focus was a structured homework support period at the school). Based on this answer, the 4th layer question was, “Why do you do your reading homework last?” In response to this question, James shared that “I don’t like doing my reading homework?” In turn we asked the following in the 5th layer, “Why do you dislike your reading homework?” to which he said, “It is too much work, so I put off doing it until the last possible moment.” It isn’t captured in James’ 5th layer answer, but he also shared that the last possible moment typically meant that he was hurriedly doing his homework on the bus ride to school in the morning. Dr. Brennan, James, and I then took all the information from our conversation and framed the root cause of James’ reading grade drop as follows: “James dislikes doing his reading homework, and as a result does it last, often on the bus ride to school in the morning.”
With the insight provided through the Five Whys and the Empathy interview, we could now design a PDSA Cycle targeted at this root cause. The rest of this post will include snapshots of each component of the PDSA along with a brief description. Like the Five Whys, the PDSA was designed by Dr. Brennan, James, and I.
Figure 4. James’ PDSA Objective & Plan
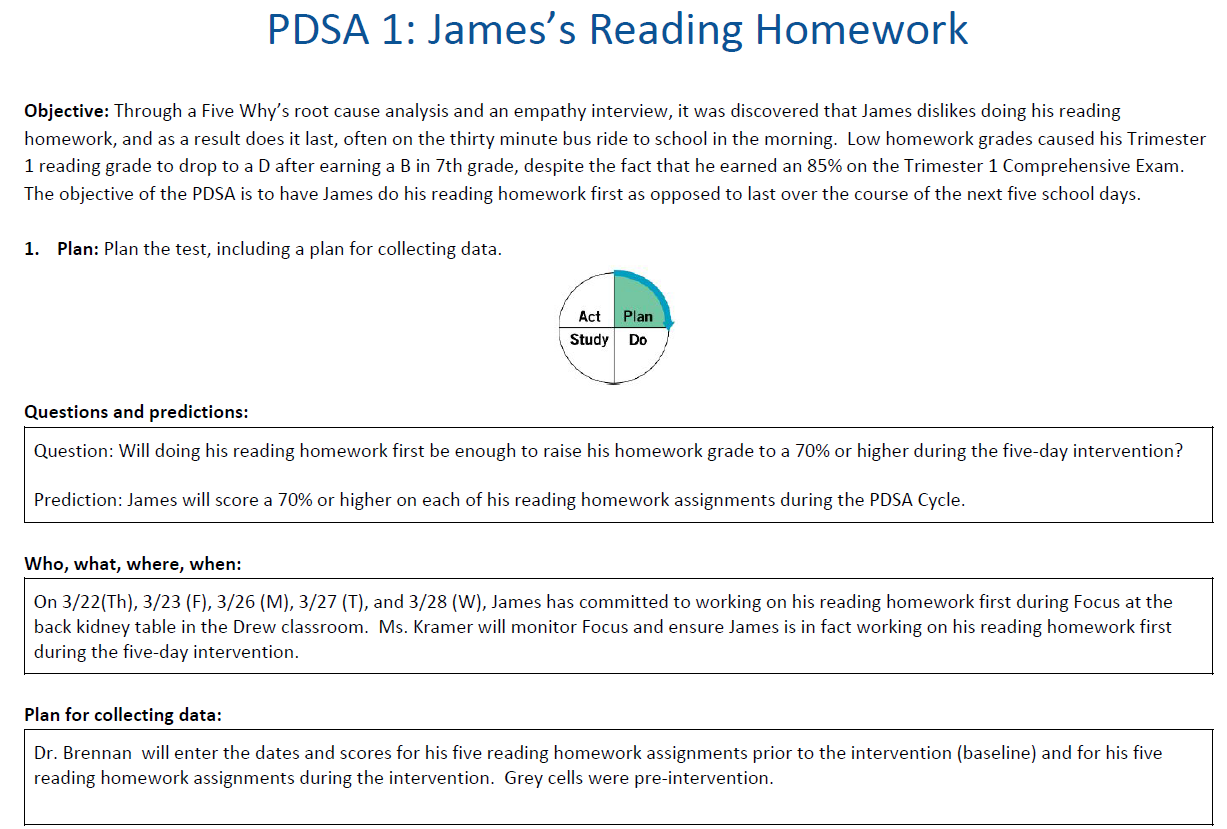
The objective of the PDSA was fairly simple based on the root cause of the reading homework issues James identified. As you can see in the template above, the objective of the PDSA was to have James do his reading homework first as opposed to last over the course of the next five school days. We went with this short time frame for two reasons. For one, we would then get back data very quickly to see if our intervention was working. The other reason we went with this short time frame was because James was not very bought into the idea. However, he did commit to trying the intervention for five days to see how it worked.
The basic question that the PDSA was designed around was “Will doing his reading homework first be enough to raise James’ homework grade to 70% or higher during the five-day intervention?” Similarly, the prediction was that he would in fact score 70% or higher on each of his reading assignments during the cycle. To accomplish this, James committed to working on his reading homework first on March 22, 23, 26, 27, and 28. He did ask for a special seating assignment at the back kidney table during Focus which was accommodated. The plan was also communicated to Ms. Kramer, who was the teacher assigned to monitor students in Focus in the Drew University classroom (all the school’s classrooms are named for universities and colleges). Throughout the cycle, Dr. Brennan committed to recording each homework grade in a simple table within the PDSA template. The data table included five pre-intervention assignments for the purpose of serving as a baseline. These baseline data points are displayed in grey in the table below. Homework assigned after the PDSA commenced are in the white rows in the same data table.
Figure 5. James’ PDSA Data Table
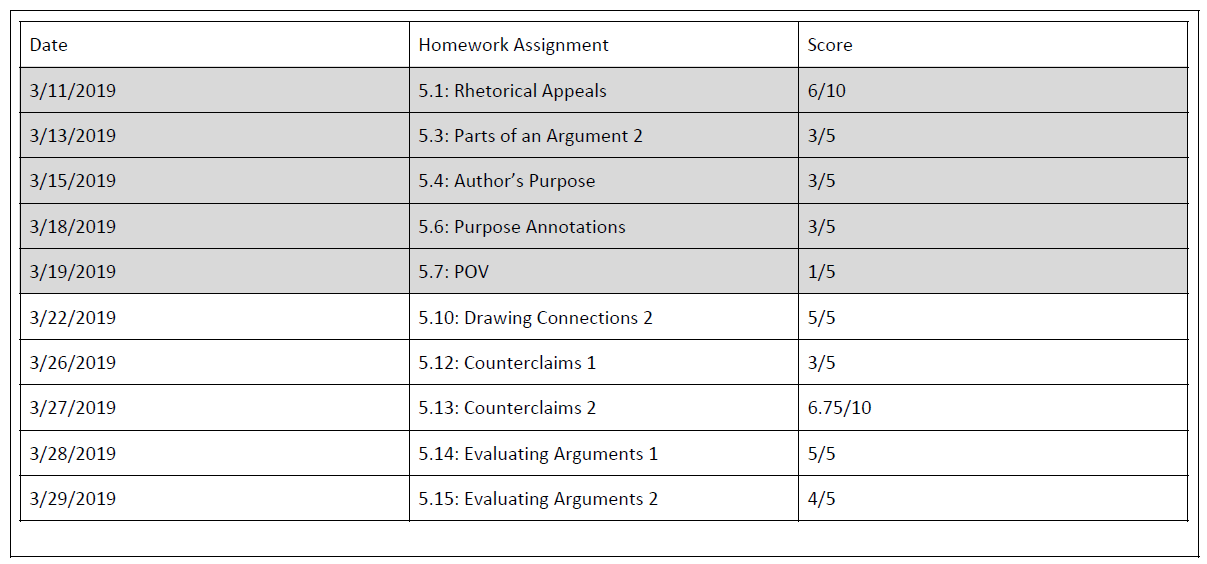
The data table was included in the Plan because this section includes a Plan for collecting data, but the data is collected after transitioning from the Plan to the Do.
Figure 6. James’ PDSA Do
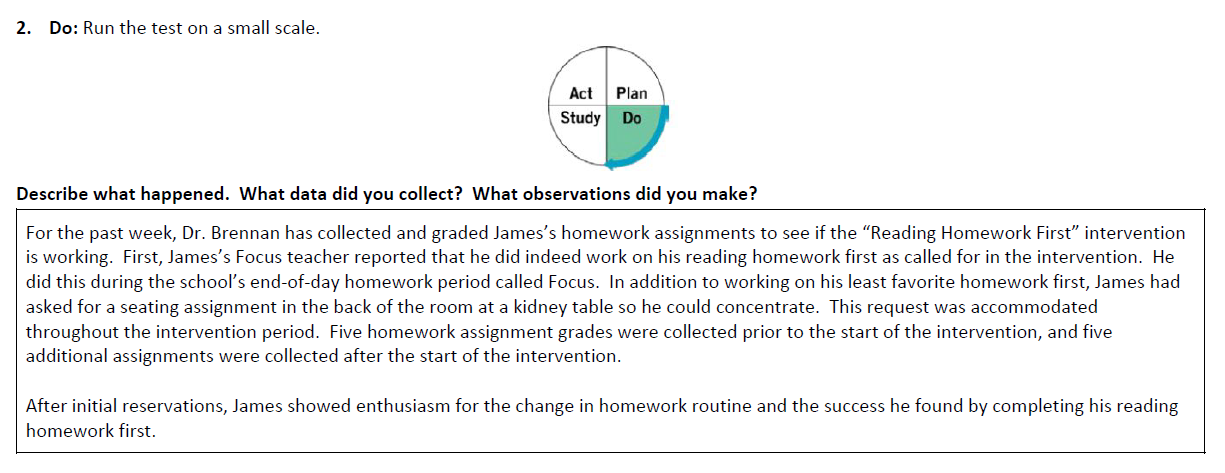
The Do section includes a description of what happened while the intervention was being tested. As noted in the snapshot, the Do unfolded just as planned. Ms. Kramer reported that James did in fact work on his reading homework first during Focus, and Dr. Brennan recorded those scores in the data table. One other item that is noted was that after initial reservations, James went from hesitance to showing enthusiasm for the idea after experiencing some early success. I won’t do a deep dive into the psychological component of the System of Profound Knowledge here, but it is worth mentioning that there is probably something to be said about the agency activated in James as an active participant in this process. This may be at the root of James’ change of attitude during the cycle.
Figure 7. James’ PDSA Study
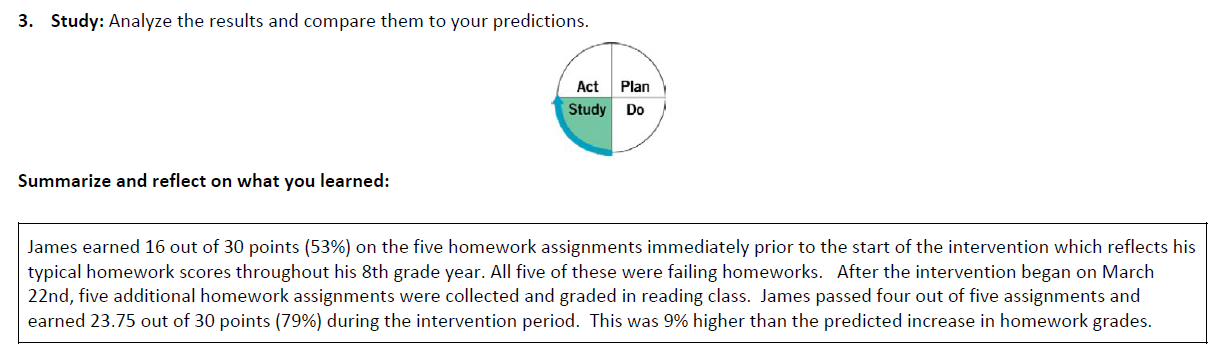
After running the five-day test, we learned some interesting things. If you look back to the specific language in our prediction, we had said that James would earn a 70% or higher on each assignment. He earned the predicted score on three out of five assignments, but if you look at all five assignments combined, he earned 79% of the points. This was 9% higher than predicted and was 26% higher than he had earned on the baseline assignments. We then had to take this information and consider how we would act on what had been learned during the cycle.
Figure 8. James’ PDSA Act
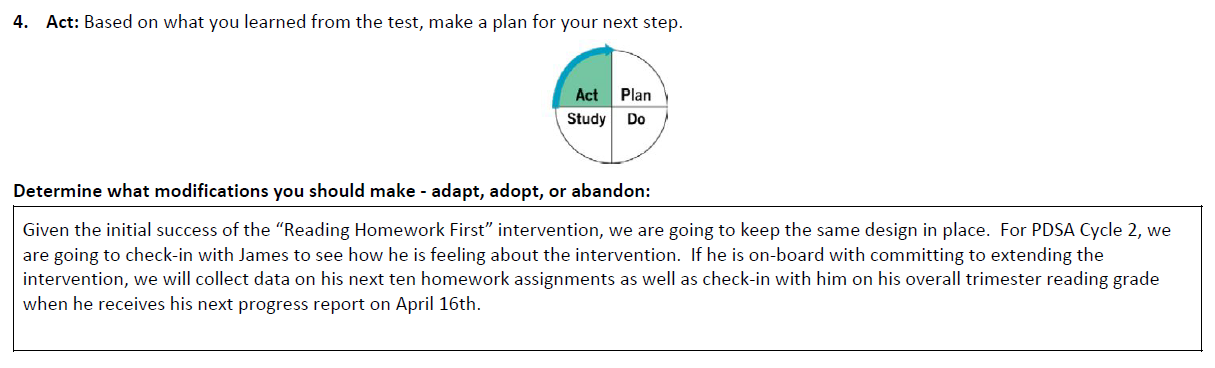
The point of the Act stage is to decide what to do next based on the learning from this PDSA Cycle. If the change idea is going to be adapted or adopted, then the Act in Cycle 1 becomes the foundation for the Plan in Cycle 2. In this case, Dr. Brennan, James, and I decided to extend the testing of this intervention over the course of an additional ten homework assignments. This probably best falls into the Adapt category because we were now going to modify the time period under which the change idea is tested. It is not Abandon because the change idea is continuing to be tested. It is not Adopt because we are not going as far as to say that the change idea will be a permanent part of James’ system.
I introduced Deming’s Plan-Do-Study-Act or learning cycle using a quote from Edward Baker last month. The final sentence of the quote was, “Two components work together in the cycle: the invisible world of theory and observation of the visible world.” The PDSA brings these two components together. We have a theory, in James’ case it was the Reading Homework First change idea, and then we observe what happens in the real world. The PDSA cycle gives us a disciplined framework by which to test our theories in real classrooms and schools. Or, as Deming put it in The New Economics:
Rational prediction requires theory and builds knowledge through systematic revision and extension of theory based on comparison of prediction with observation.
With this knowledge, the PDSA template from my last post, and the PDSA-in-action example in hand, try the Plan-Do-Study-Act methodology in your own school or district, and let me know how it goes.
***
John A. Dues is the Chief Learning Officer for United Schools Network, a nonprofit charter-management organization that supports four public charter schools in Columbus, Ohio. Send feedback to jdues@unitedschoolsnetwork.org.
Notes:
[1] James is a pseudonym.
[2] Emily Krone Phillips, The Make or Break Year: Solving the Dropout Crisis One Ninth Grader at a Time. (New York & London: The New Press, 2019).
[3] The University of Chicago, Urban Education Institute, Uchicago Consortium on School Research. “Free to Fail or On-Track to College: Why Grades Drop When Students Enter High School and What Adults Can Do About It.” By Todd Rosenrkanz, Marisa de la Torre, & Elaine Allensworth, September 2014, consortium.uchicago.edu/publications/free-fail-or-track-college.
[4] Dues, John A. “A Formula for Improvement.” School Performance Institute,30 March 2019, United Schools Network, www.schoolperformanceinstitute.org/blog/2019/3/29/a-formula-for-improvement.