Successful remote learning requires a whole new system
Note: The School Performance Institute’s Learning to Improve blog series typically discusses issues related to building the capacity to do improvement science in schools while working on an important problem of practice. However, in the coming weeks, we’ll be sharing how the United Schools Network, a nonprofit charter management organization based in Columbus, Ohio, is responding to and planning educational services for our students during the COVID-19 pandemic and school closures.
The transition to remote learning due to the coronavirus pandemic has significantly shifted how United Schools Network (USN) plans and delivers educational experiences to its students. We've outlined our remote learning system—and it is helpful to think of it as a system—in our Education Plan. As soon as that document was created, and the new system was outlined, we immediately started thinking about how to improve it.

A first step in understanding this new remote learning system is to visualize the processes that happen in a single classroom. This visualization process, combined with asking key questions about the process steps, can help reveal areas for improvement, as well as areas where the system could potentially break down. I’ve illustrated the process steps for an eighth grade math classroom, along with key questions, in the flow chart below.

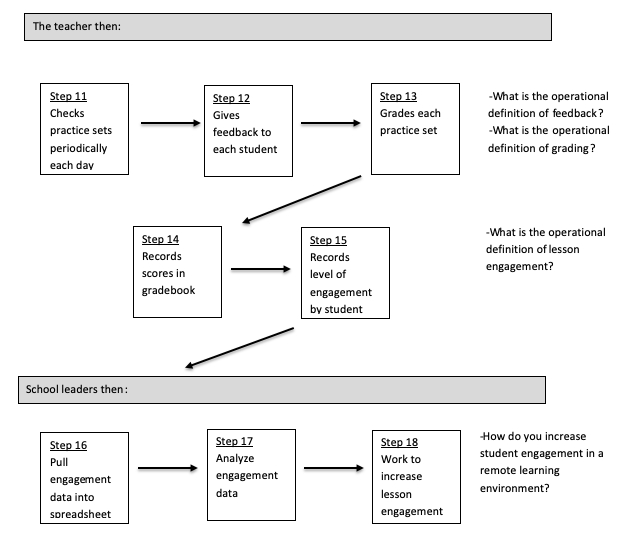
Mapping a system in this way serves a number of purposes. First, it is helpful for school teams to understand how each teacher operationalizes the Education Plan. In Steps three through six, it is clear how the eighth grade math teacher is thinking about lesson design in the remote learning environment. Second, the complexity of the system becomes much clearer when the process steps are listed. You can visualize where the system may break down. Third, the flow chart highlights process steps in the system that may be vulnerable to access and equity issues for different student groups. For example, a breakdown could easily happen right at the start of the process if the information from Step 1 (device access) and Step 2 (internet access) aren’t stored in the same location. Fourth, the flow chart allows teams to start thinking about the key questions from each process step and in turn how to improve the system.
Early data being collected at each USN school indicate that there is significant variation in terms of student engagement with remote learning. However, before we can work on improving student engagement levels, we have to fully understand each teacher’s process for designing and delivering instruction, as well as have clearly articulated operational definitions for key remote learning concepts. The four concepts we've keyed in on include those for lesson, feedback, grading, and engagement in a remote learning environment.
As soon as we have those four in place, we can then start measuring and working to improve engagement levels. This will be a critical next step given that Governor DeWine recently extended the school closure order in Ohio through the end of the school year. We’ll share those definitions in the next article in this series.
John A. Dues is the Managing Director of School Performance Institute and the Chief Learning Officer for United Schools Network, a nonprofit charter-management organization that supports four public charter schools in Columbus. Send feedback to jdues@unitedschoolsnetwork.org.